Michael Stangl
74e08f389c
Michael Stangl
74e08f389c
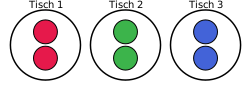
Sitzplatzverteilung.alsSVG() (libs/Strukturdaten.py) draws tables as
white circles and people as colored circles inside their table's
circle, colored by group membership. Table radius is derived from
the number of seats so all person-circles fit without touching; the
table-to-table grid spacing is derived from the largest table radius
so tables never overlap regardless of their Koordinaten values.

libs/platz.py gains a --tosvg switch that writes
<indir>/Sitzplatzverteilung.svg alongside the existing text/CSV
output.

The three unittest scenarios now each write their rendering to
doc/images/, and doc/docu_tests.md explains the three configurations
and what each test actually verifies (including why the "split
groups land on true neighbor tables" property only holds for a
specifically chosen seed in the circle scenario, not in general).

Co-Authored-By: Claude Sonnet 5 <noreply@anthropic.com>
1.2 KiB
1.2 KiB