 Michael Stangl
644f61ef6b
Michael Stangl
644f61ef6b
Zyklus/Farm:
- neuer adaptiver Modus: grosse Startpopulation, die je Generation
  schrumpft (Start/Schrumpfung/MinPopulation) und bei Konvergenz stoppt
  (Geduld Generationen ohne Verbesserung >= Schwelle, max MaxGenerationen)
- Zyklus.laden erkennt adaptives Profil am Feld 'Start' (Modus adaptiv),
  sonst klassisch (Abfolge/Anzahl); Farm._LaufStatisch/_LaufAdaptiv
- neue Trunkierungs-Selektion Farm.PopulationBegrenzen
- [Adaptiv]-Profil in zyklus.cfg (dokumentiert)

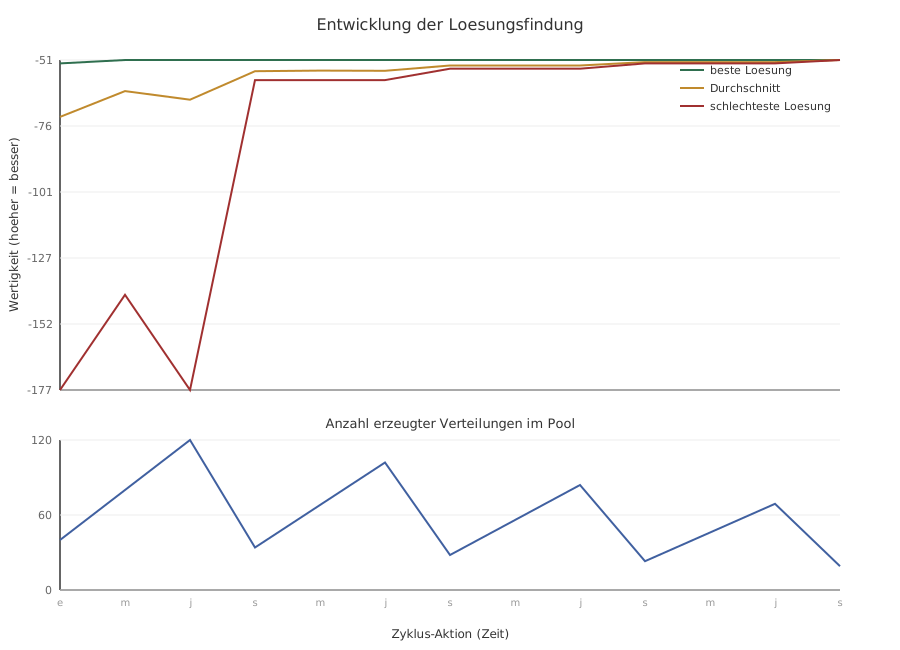
Entwicklungsgrafik:
- zweites Panel unter dem Verlauf zeigt die Anzahl erzeugter
  Verteilungen im Pool je Schritt (gemeinsame Zeitachse)

Konfiguration:
- platz.cfg entfernt; zyklus.cfg/strafen.cfg werden direkt aus
  $PLATZ_CFG geladen
- neuer Schalter --zyklus-art (Default Adaptiv) waehlt das GA-Profil
- web/main.py analog: direktes Laden, Profil via PLATZ_ZYKLUSART

Doku (README.md, CLAUDE.md) und Tests entsprechend aktualisiert;
Beispiele mit dem Adaptiv-Default neu berechnet.

Co-Authored-By: Claude Opus 4.8 <noreply@anthropic.com>
54 lines
4.7 KiB
XML
54 lines
4.7 KiB
XML


<?xml version="1.0" encoding="UTF-8"?>
|
|
<svg xmlns="http://www.w3.org/2000/svg" width="900" height="650" viewBox="0 0 900 650" font-family="sans-serif">
|
|
<rect width="100%" height="100%" fill="white"/>
|
|
<text x="450" y="30" text-anchor="middle" font-size="16" fill="#333">Entwicklung der Loesungsfindung</text>
|
|
<line x1="60" y1="60" x2="60" y2="390.0" stroke="#333" stroke-width="1.5"/>
|
|
<line x1="60" y1="390.0" x2="840" y2="390.0" stroke="#333" stroke-width="1.5"/>
|
|
<line x1="60" y1="390.0" x2="840" y2="390.0" stroke="#eee" stroke-width="1"/>
|
|
<text x="52" y="394.0" text-anchor="end" font-size="11" fill="#666">-177</text>
|
|
<line x1="60" y1="324.0" x2="840" y2="324.0" stroke="#eee" stroke-width="1"/>
|
|
<text x="52" y="328.0" text-anchor="end" font-size="11" fill="#666">-152</text>
|
|
<line x1="60" y1="258.0" x2="840" y2="258.0" stroke="#eee" stroke-width="1"/>
|
|
<text x="52" y="262.0" text-anchor="end" font-size="11" fill="#666">-127</text>
|
|
<line x1="60" y1="192.0" x2="840" y2="192.0" stroke="#eee" stroke-width="1"/>
|
|
<text x="52" y="196.0" text-anchor="end" font-size="11" fill="#666">-101</text>
|
|
<line x1="60" y1="126.0" x2="840" y2="126.0" stroke="#eee" stroke-width="1"/>
|
|
<text x="52" y="130.0" text-anchor="end" font-size="11" fill="#666">-76</text>
|
|
<line x1="60" y1="60.0" x2="840" y2="60.0" stroke="#eee" stroke-width="1"/>
|
|
<text x="52" y="64.0" text-anchor="end" font-size="11" fill="#666">-51</text>
|
|
<text x="18" y="225.0" text-anchor="middle" font-size="12" fill="#333" transform="rotate(-90 18 225.0)">Wertigkeit (hoeher = besser)</text>
|
|
<polyline points="60.0,63.4 125.0,60.0 190.0,60.0 255.0,60.0 320.0,60.0 385.0,60.0 450.0,60.0 515.0,60.0 580.0,60.0 645.0,60.0 710.0,60.0 775.0,60.0 840.0,60.0" fill="none" stroke="#2f6f4f" stroke-width="2"/>
|
|
<polyline points="60.0,116.9 125.0,91.1 190.0,99.7 255.0,71.2 320.0,70.6 385.0,70.8 450.0,65.5 515.0,65.5 580.0,65.5 645.0,62.1 710.0,62.1 775.0,62.1 840.0,60.0" fill="none" stroke="#c08a2d" stroke-width="2"/>
|
|
<polyline points="60.0,390.0 125.0,294.8 190.0,390.0 255.0,80.1 320.0,80.1 385.0,80.1 450.0,68.7 515.0,68.7 580.0,68.7 645.0,63.4 710.0,63.4 775.0,63.4 840.0,60.0" fill="none" stroke="#a03030" stroke-width="2"/>
|
|
<line x1="680" y1="70" x2="704" y2="70" stroke="#2f6f4f" stroke-width="2"/>
|
|
<text x="710" y="74" font-size="11" fill="#333">beste Loesung</text>
|
|
<line x1="680" y1="88" x2="704" y2="88" stroke="#c08a2d" stroke-width="2"/>
|
|
<text x="710" y="92" font-size="11" fill="#333">Durchschnitt</text>
|
|
<line x1="680" y1="106" x2="704" y2="106" stroke="#a03030" stroke-width="2"/>
|
|
<text x="710" y="110" font-size="11" fill="#333">schlechteste Loesung</text>
|
|
<text x="450" y="428.0" text-anchor="middle" font-size="13" fill="#333">Anzahl erzeugter Verteilungen im Pool</text>
|
|
<line x1="60" y1="440.0" x2="60" y2="590.0" stroke="#333" stroke-width="1.5"/>
|
|
<line x1="60" y1="590.0" x2="840" y2="590.0" stroke="#333" stroke-width="1.5"/>
|
|
<line x1="60" y1="590.0" x2="840" y2="590.0" stroke="#eee" stroke-width="1"/>
|
|
<text x="52" y="594.0" text-anchor="end" font-size="11" fill="#666">0</text>
|
|
<line x1="60" y1="515.0" x2="840" y2="515.0" stroke="#eee" stroke-width="1"/>
|
|
<text x="52" y="519.0" text-anchor="end" font-size="11" fill="#666">60</text>
|
|
<line x1="60" y1="440.0" x2="840" y2="440.0" stroke="#eee" stroke-width="1"/>
|
|
<text x="52" y="444.0" text-anchor="end" font-size="11" fill="#666">120</text>
|
|
<polyline points="60.0,540.0 125.0,490.0 190.0,440.0 255.0,547.5 320.0,505.0 385.0,462.5 450.0,555.0 515.0,520.0 580.0,485.0 645.0,561.2 710.0,532.5 775.0,503.8 840.0,566.2" fill="none" stroke="#4060a0" stroke-width="2"/>
|
|
<text x="60.0" y="606.0" text-anchor="middle" font-size="10" fill="#999">e</text>
|
|
<text x="125.0" y="606.0" text-anchor="middle" font-size="10" fill="#999">m</text>
|
|
<text x="190.0" y="606.0" text-anchor="middle" font-size="10" fill="#999">j</text>
|
|
<text x="255.0" y="606.0" text-anchor="middle" font-size="10" fill="#999">s</text>
|
|
<text x="320.0" y="606.0" text-anchor="middle" font-size="10" fill="#999">m</text>
|
|
<text x="385.0" y="606.0" text-anchor="middle" font-size="10" fill="#999">j</text>
|
|
<text x="450.0" y="606.0" text-anchor="middle" font-size="10" fill="#999">s</text>
|
|
<text x="515.0" y="606.0" text-anchor="middle" font-size="10" fill="#999">m</text>
|
|
<text x="580.0" y="606.0" text-anchor="middle" font-size="10" fill="#999">j</text>
|
|
<text x="645.0" y="606.0" text-anchor="middle" font-size="10" fill="#999">s</text>
|
|
<text x="710.0" y="606.0" text-anchor="middle" font-size="10" fill="#999">m</text>
|
|
<text x="775.0" y="606.0" text-anchor="middle" font-size="10" fill="#999">j</text>
|
|
<text x="840.0" y="606.0" text-anchor="middle" font-size="10" fill="#999">s</text>
|
|
<text x="450" y="638" text-anchor="middle" font-size="12" fill="#333">Zyklus-Aktion (Zeit)</text>
|
|
</svg>
|